Choosing A Pump For Your Irrigation System
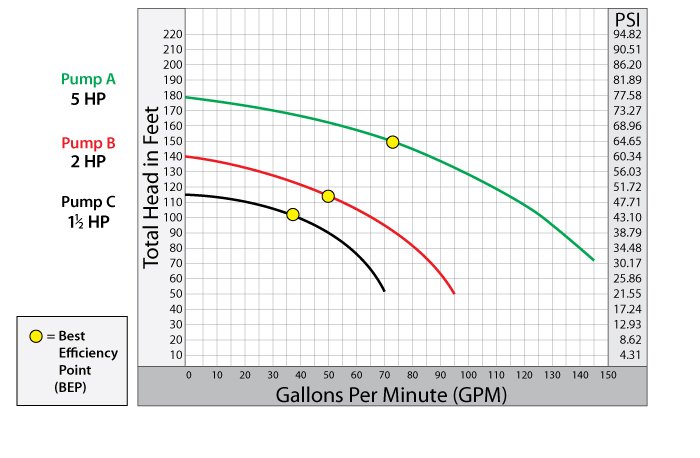
The article explains how to choose a pump. The best way to choose the correct pump size for your irrigation system is to read the pump curve, which is a performance chart provided by the pump manufacturer. This chart shows a pump’s performance curve over a range of pressures and flows. A Pump’s curves are measured and shown in “head in feet”. However, since most people don’t know how to convert “head in feet” to PSI, many pump curves also measure by psi, as well. (See Sample Pump Curve below)
Pump Curve Chart:
Determine the Flow Rate for the Zones:
The first step to choosing a pump is to determine which zone in your irrigation system requires the highest psi and puts out the greatest flow. In a properly designed sprinkler system, each sprinkler head in a single zone should operate at the same pressure. Therefore, after you have determined the required operating pressure for your most demanding zone, you need to calculate the total flow rate for the zone. This means adding up the amount of water (measured in gallons per minute, or GPM) each individual sprinkler head puts out in that single zone.
For example, once I determine what my most demanding zone is, and establish what the operating pressure is, I then determine the flow rate of each sprinkler head in that zone and add them together.
So if I had three heads producing 3 GPM each, and two heads producing 5 GPM each, I would add up 3 GPM + 3 GPM + 3 GPM + 5 GPM + 5 GPM = 19 GPM. That is the total flow rate for that zone.
Determine the Flow Rate for the Sprinkler Head: Choose a Pump
To determine the flow rate of each sprinkler head, you need to look up each head on its respective manufacturer’s website. Manufacturers provide flow charts for their sprinkler heads, that indicate how many GPM’s at different pressures. You would find the operating pressure your sprinkler head is operating at, and note the corresponding GPM on the chart.
If every sprinkler head in that zone were exactly the same model from the same manufacturer, you would only have to do this once, and then multiply the GPM number by the number of heads you had in that zone.
After getting these two numbers, you would begin looking at pumps and checking their pump curves. Here are step-by-step instructions for reading a pump chart.
How to Read a Pump Chart:
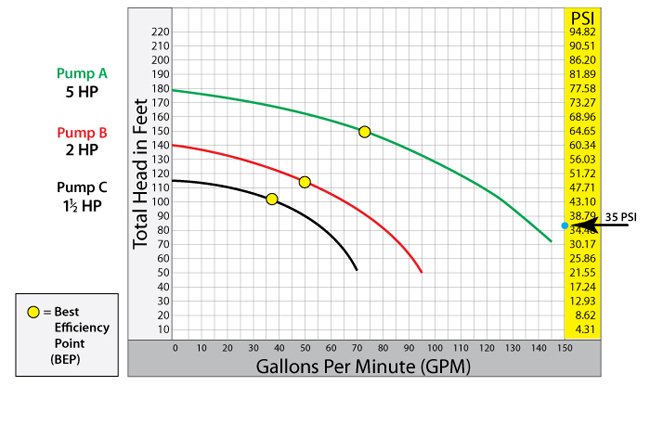
- Look in the column labeled “psi” and find the psi your most demanding zone operates at. For this example, we’ll say the zone operates at 35 psi. This point is marked in the highlighted column by the blue dot. (See Sample Pump Curve below)
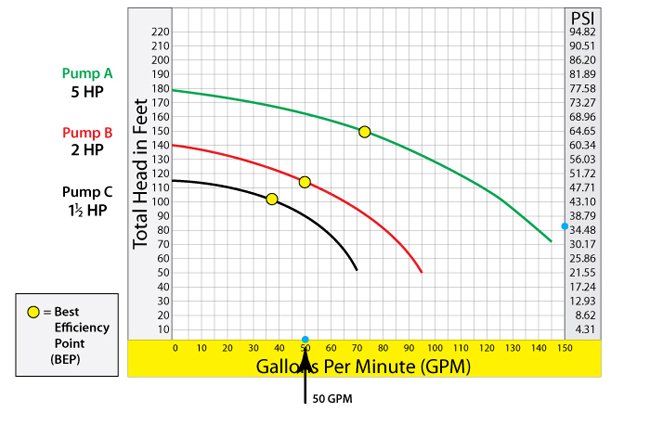
- Look at the row labeled gallons per minute and find the total flow produced by your most demanding zone. We’ll say our zone requires 50 GPM. So, this point is marked in the highlighted row by the blue dot. (See Sample Pump Curve below)
- Follow the grid lines from the operating pressure point and the GPM point you have selected to the place on the chart where they intersect. This point is marked by the large blue dot. (See Sample Pump Curve below)
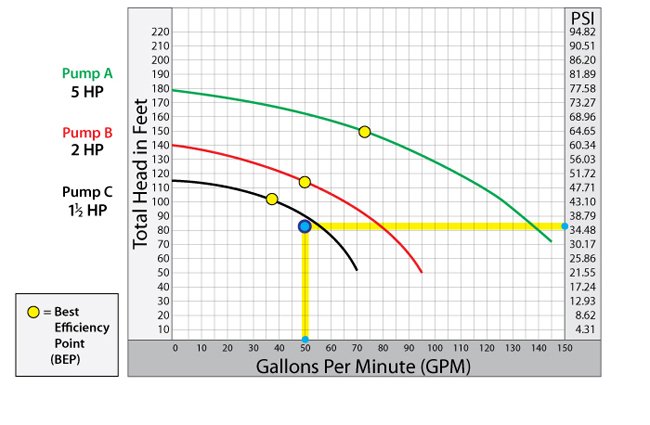
- Note which pumps’ curves arc over this point on the chart. Any pumps with curves that encompass this point are capable of meeting your system’s needs. All three pumps on this chart are capable of meeting these specs.
- Note the “sweet spot” or most efficient operating range on a pump’s curve (called the BEP, or Best Efficiency Point); this is located at the center or halfway point of the curve.
- If more than one pump curve corresponds with your system’s specs, choose the pump with the BEP that lines up best with the point on the chart representing your system’s requirements. In this case, that would be Pump B; the BEP is directly over the point representing your system’s requirements.


